Data Teams as Gatekeepers to Unlock Brownfield Cleanups

Environmental data teams methodically confirm cleanup levels and visualize the 'cleanup finish line' with the regulatory criteria and client end goals

What is the measure of ‘clean’ at brownfield sites? Before any digging of contaminated dirt or treatment of contaminated groundwater, there is much upfront work by regulators and project teams – chemists, data analysts, geologists, engineers, and more – to determine the appropriate cleanup levels to use for a given site. The cleanup levels are the north star that every brownfield cleanup team steers by.

To Succeed, Be Sure What ‘Clean’ Looks Like

Aspect’s environmental data team regularly keeps the finger on the pulse of regulatory databases and uses tools – such as the open-source programming language R – to streamline brownfield cleanup projects.

Using R to automate screening level updates allows project teams to:

  • Make changes quickly and confidently

  • Minimize the risk of errors and omissions

  • Provide much-improved process transparency

  • Streamline communications across the project team

Keeping up on the best available science gives project managers greater assurance that their sites are being appropriately measured against regulatory criteria, providing a smoother path forward in the management and remediation of contaminated sites.

A Peek into Regulatory Data World with CLARC

CLARC is the Washington State Department of Ecology’s (Ecology) Cleanup Levels and Risk Calculation spreadsheet that is the basis for calculating cleanup levels under Ecology’s Model Toxics Control Act (MTCA). MTCA is Washington state’s cleanup rule which governs over 13,000+ known or suspected contaminated sites. CLARC is a key measure of what defines success at these cleanup projects and a living document that is maintained and updated by Ecology, as needed, with major updates every six months to align with changes to state and federal regulatory (e.g., US Environmental Protection Agency (EPA)) criteria.

Aspect engineer evaluating a vapor intrusion system at Art Brass Plating – a South Seattle cleanup site. The measure of success for these systems — and projects — rely on knowing the correct and up-to-date cleanup level criteria

The data tables in CLARC provide the various input parameters used to calculate screening levels for a huge array of chemicals in soil, groundwater, surface water, soil gas, and air—as well as the resulting calculated cleanup level values themselves. The calculated values are routinely used by remediation project managers to screen analytical results (from samples collected in the field) against federal, state, or other regulatory thresholds.

What is R and How Does it Accurately Automate Away Manual Data Entry?

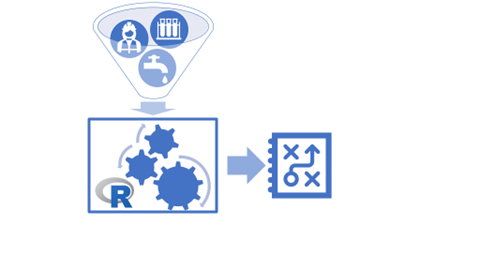
R is an open-source software environment used for statistical computing and graphics. Recently, Aspect’s data team wrote a package of R code to use CLARC’s input parameters to calculate a suite of specific screening levels. The same code can be run any time the input values in CLARC are updated, generating quality assurance tables to alert Aspect’s data team of potential issues, and providing summary tables for Aspect project managers to review cleanup level changes and consider their potential impact to their various environmental sites.

Various input parameters, including regulatory requirements, chemistry, site use, human safety and environmental quality are entered into our custom R tool to make and maintain a reliable, reproducible metric set for project success

Since there are usually screening levels for hundreds of different analytes at remediation cleanups  – e.g., petroleum and diesel, arsenic, tetrachloroethylene and more – when the CLARC database is updated by the regulator, it can be difficult to see if there have been any changes and which analytes may have been affected.

Aspect uses the industry standard EQuiS environmental data management system. The R tool helps us better use EQuIS to manage and screen environmental data against cleanup levels. Before using R, preparing CLARC-based screening and cleanup levels for upload to EQuIS required tedious data wrangling in Excel and institutional knowledge of what analytes should be compared to which screening levels. With R, the process involves little more than a click of a button

Data Problem Solving that Makes Remediation Easier

R simplifying the complexity of the brownfield cleanup level process

Brownfield remediation cleanups require imagining a range of scenarios for the future use of a ‘clean’ property. Will the site be used for residential, commercial, or industrial purposes? What pollutants are present and where? It all starts with the cleanup level criteria.

Overall, this work by Aspect’s data team – who are meticulous at knowing the state-of-the-science regulatory criteria – ensures Aspect’s project teams have the correct screening or cleanup levels based on the most current toxicity guidance, which helps avoid rework later on in the process and saves time and money for the client.

Putting Data to Work: Kubota Garden Stormwater Story Map

Mud and sand carried by stormwater is washing into the catch basins and through the ponds at the beautiful Kubota Garden in south Seattle. Learn about how a savvy team including a mapmaker, field staff, water quality expert, engineer, and landscape architect put data to use to determine the sources of sediment and craft a plan to restore the garden to the delight of its visitors.

Click to learn how Aspect used Esri StoryMaps to help guide the Kubota Garden Foundation and the City of Seattle (SPU, Seattle Parks and Rec, and SDOT) through the decision-making process.

Riverbank: Quickbooks for Water Managers

Riverbank Logo.png

In ‘water-short’ basins and agricultural centers, many Pacific Northwest water managers – e.g., counties, PUDs, irrigation districts, cities --  wrestle with how to accurately measure water used to meet a range of development, agricultural, and habitat goals. In Washington State, the $300M 2018 Streamflow Restoration Act was the trigger that changed how cities, counties and others track rural water use, pushing water managers to ‘account’ for water in rural building projects and water that can be saved for fish and streams. Aspect developed Riverbank, a cloud-based water accounting application, to make it easier to manage, evaluate, and keep track of the water balance sheet.

Spreadsheets Aren’t Adequate for Managing Critical Water Use Data

Riverbank provides the transparency and reliability to radically cut the time water managers take to do water accounting math and reporting

The ‘old’ tools like Excel are ill-equipped to deal with accounting complexities such as managing different mitigation sources across drainage basins (e.g., trust water rights), and variable accounting rules/logic (e.g., consumptive use). Add to that the inherent risk of tracking mission-critical data inside a spreadsheet, and this can be a frustrating, expensive, and precarious process for a water manager trying to meet water management guidelines and business needs.

Enter Riverbank—A cloud-based application for managing the water balance sheet

The Riverbank application is a web-based accounting system that is wired into other workflows (like permitting processes and GIS) to meet the myriad reporting and planning needs that water managers have. It's tooled to the very specific conditions of water accounting at a basin-scale and developed to support the "living ledger" requirements that allow agencies to keep track of and report out on where they stand relative to resource/growth management requirements.

Riverbank provides an easy-to-use and share summary of water use accounting across subbasins and water reserves.

Water Banking and ‘Mitigation’ is the Future

Most PNW basins are over-appropriated during the summer when demand for water continues to expand and ‘mitigation’ is here to stay.  Water banking (using water stored or held in trust to mitigate for new demand) is likely the future for public agencies needing to serve additional customers (counties, PUDs, irrigation districts, cities) and for private developers wishing to  build new properties.  However, mitigation only works if it is tracked and reported.

Links for Foster and Hirst cases.

Links for Foster and Hirst cases.

Visualizing Rural Water Use in Chelan and Okanagan Counties

Riverbank provides the transparency and reliability to radically cut the time water managers take to do water accounting math and reporting. Chelan County and Okanagan County currently use Riverbank to meet permit-exempt well tracking responsibilities required by the Washington State Department of Ecology.

With Riverbank, thousands of parcels served by permit-exempt wells are tracked and visualized -- including details on associated building permits, irrigation water supplies, additional dwelling units, and more. GIS technology in Riverbank allows the system to automatically assign basin-specific accounting rules and water use assumptions to each parcel.

Contact Senior Data Scientist Blair Deaver or Associate Data Scientist Parker Wittman to learn more about how Riverbank can help you.

Guiding Operators to Safe Design for 1,100+ Dams

The public perception of water supply dams may bring to mind huge reservoirs, such as the Hoover Dam in Nevada and, in the Pacific Northwest, the Grand Coulee dam. However, Washington state also is charged with regulating and monitoring over a thousand dams of varying sizes, most of them under 50 feet tall. These largely earthen dams are used for a variety of irrigation, water quality, and recreation purposes.

Grand Coulee Dam
Source: Bureau of Reclamation

Helping Dam Owners Plan for Storm and Precipitation Impacts on Dams

Washington’s Dam Safety Office conducts design, planning, and construction inspection and monitoring to ensure dams and owners (the majority of the dams they monitor are privately owned) operate in a safe manner. As part of the regulations, dams are required to meet specific risk-based design requirements during major storms, particularly anticipating heavy rain and or snow events.

Every 10 years, precipitation data is gathered across hundreds of weather stations throughout the state for storm event analysis to help determine safety design criteria. These data and analysis are used by dam owners and state dam safety engineers to ensure design requirements are met.

A Better Software Tool for Dam Safety Projects

“We are very happy with the updated calculator developed by the Aspect-MGS team. It will benefit many dam engineers for the next decade.”

- Dam Safety Office manager Joe Witczak.

Aspect’s software development team, in collaboration with Washington’s Dam Safety Office and MGS Engineering Consultants, co-designed and developed a more user intuitive application for both dam owners and dam safety engineers for risk-based design. The Precipitation Magnitude-Frequency Calculator application helps dam owners determine their requirements by dam location and storm duration event. Users can now more easily select their dam location, storm event durations (small, medium, large), and quickly see the safety design requirements for their particular location. The new calculator is available to download as a zip file on the state’s website.

Contact Chris Bellusci and Mike Mills for more information on Aspect’s software development services for science and engineering projects.

Robyn Pepin and Spencer Ambauen Talk Fish Habitat Solutions at River Restoration Northwest

The 19th annual River Restoration Northwest symposium is this week in Stevenson, Washington. Representatives from Aspect’s Seattle, Wenatchee, and Portland offices are attending to cheer on presentations by two of our colleagues focused on removing fish passage barriers in the Pacific Northwest.

Senior GIS Analyst Robyn Pepin’s presentation “Data-Driven Decision Making: An Innovative Prioritization Tool for Restoration (and more!)” showcases the methodology behind the GIS-based tool she created in partnership with the Upper Columbia Salmon Recovery Board that synthesizes and streamlines numerous data sets to prioritize what barriers are most need of removal in the Wenatchee Basin.

Spencer Ambauen is presenting his poster on the Geosynthetic Reinforced Soil-Integrated Bridge System (GRS-IBS). This bridge construction system is made from alternates layers of compacted structural fill soils and a mesh-like geosynthetic reinforcement that can be used in many subsurface and seismic conditions. For public agencies looking to replace hundreds of aging, undersized culverts and other structures hindering riparian habitat, GRS-IBS bridges are a less expensive option that are easier to construct and maintain. These bridges becoming more common across the east coast, but so far there have been only two constructed in Washington state. Spencer is well familiar with the GRS-IBS system; masters thesis involved numerical modeling to evaluate how these bridges behave under surcharge loading, and he completed design for an GRS-IBS bridge for the Washington State Department of Fish and Wildlife to enhance fish passage at Tolmie State Park near Olympia.

Robyn Pepin Talks Fish Passage Barrier Prioritization on GIS Podcast

Senior GIS Analyst Robyn Pepin was recently a guest on the GIS-focused podcast Will We Make it Out Alive?

In an episode titled “A Culvert Affair,” hosts Amy and Jen talked with Robyn about the Fish Passage Barrier Prioritization Tool she developed for the Upper Salmon Recovery Board to prioritize which culverts and other obstructions blocking fish passage should be removed first, and how she continues to adapt and improve it as needed for other agencies. Robyn also walks listeners the Flow Network tools she used to create the tool.

Listen to Robyn and other episodes of the podcast here.

How to Deliver More Successful GIS Outreach Campaigns at NW GIS in Bend

Conducting a successful public outreach and/or marketing campaign using GIS is more involved than just publishing a web-map. Marketing, communication, design professionals, and a wide range of other professionals are increasingly seeing the value of map-based infographics to promote marketing and communication campaigns. Aspect’s Blair Deaver recently presented at the Northwest GIS User Group on how to conduct a successful marketing campaign that involves GIS. Blair has developed successful story map campaigns and he brought his experience on those to propose marketing tips outside of simply publishing your web map such as:

  • Messaging and Audience

  • SEO/SEM considerations

  • Engagement with marketing, communication, and management colleagues

  • Increasing Virality

  • Measuring Impact

In addition to Blair’s presentation, Aspect’s GIS crew was thrilled to learn their fish passage poster presentation — visualizing Aspect’s fish passage removal GIS tool — won the award for “Best Analysis.”

From left, Parker Wittman, Robyn Pepin, Emelie Crumbaker, and Blair Deaver

Learn more about the conference here.

Attracting Talent – Simple Steps, Great Results

Lindsay Pearsall - Director of Human Resources

Earth science and engineering firms are in a buyer’s market in 2019. Anyone in a leadership position in the Architectural/ Engineering/ Construction industry knows the mantra of “Always Be Recruiting.” At Aspect, we are no different. Our success (and our clients’) hinges on our ability to find and retain the most talented consultants in our industry. It’s essential, then, that our Human Resources department takes a very thoughtful approach to finding and hiring this top-tier talent.

Recently, at RecruitMAX 2019 – one of the A/E/C industry’s top professional industry conferences—Aspect’s HR Director Lindsay Pearsall shared a segment of her approach with a presentation “How to Build a REAL Candidate Pipeline with Phone Interviews and Informational Interviews.”

Some takeaways of Lindsay’s presentation are:

  • Why treating your candidate like a client should be your #1 priority

  • Conducting informational interviews to go beyond your current hiring needs

  • Simple solutions, like how and when to follow up with individuals, to maintain relationships

Lindsay’s presentation stressed that hiring managers need to remember how difficult it is to be a candidate. By flipping the script and treating candidates like a client, we are able to humanize the experience. Whether someone is hired or not, they should have an expectation of a positive experience and feel valued as a professional and as a human.

See current job openings for Aspect here: https://www.aspectconsulting.com/careers

New GIS Tool Helps Remove Barriers to Salmon Habitat Connectivity

Clean, cold water. Lush riparian vegetation. Gravels for spawning. These are some of the elements that create healthy habitat for salmon. The Upper Columbia region has some of the best in the Pacific Northwest. Unfortunately, not all of this habitat is within the salmon’s reach. Removing barriers such as culverts and dams is a top priority for salmon recovery goals, but there are thousands of barriers, limited resources to remove them, and a diverse group of stakeholders with issues to address. What everyone wants to know first is: how do we decide WHICH barriers to remove?

Instream barriers such as culverts like this can limit fish passage to available habitat.

Enter a New Tool for Fish Habitat Decision Making

In partnership with the Cascade Columbia Fisheries Enhancement Group, the Upper Columbia Salmon Recovery Board, the Upper Columbia Regional Technical Team (RTT), and a technical steering committee, Aspect created a GIS-based decision support tool that summarizes the overall quality of ecological conditions surrounding each instream barrier within the Wenatchee Basin. This custom spatial model provides insight into critical questions regarding barrier-removal priority:

  • Is there habitat available upstream from the barrier that salmon currently cannot access?

  • Is that available habitat of sufficient quality for salmon?

  • Is there known fish usage near the barrier already?

  • Are there barriers downstream blocking fish access?

This prioritization tool provides salmon-recovery stakeholders with a common approach to answer these questions. The variables under consideration at a barrier—upstream habitat quality, local stream temperature, connectivity to other barriers, etc.—each receive a score. Those scores are then added up to a total priority tier ranking for that barrier. By assessing each barrier through this scoring process, we’ve created an actionable apples-to-apples comparison of habitat benefits associated with barrier removal.

A preview of barrier removal ranking priority data.

A Tier 1 ranking indicates the top priority for removal, indicating more biological benefit gained from a barrier’s removal. Tier 4 ranking is the lowest priority ranking, indicating little biological benefit gained from a barrier’s removal. UCSRB and the RTT use these categories to guide decisions on proposed project funding. The rankings are updated as available data sources improve.  Preview the results HERE. This tool will allow stakeholders to align and coordinate their barrier removal work towards the larger common goal of salmon-habitat connectivity within the Upper Columbia and throughout the state.

If interested in adapting this tool for your project and/or basin(s), contact Robyn Pepin for more information.

ETA (6/3/2019): Robyn Pepin and Taylor Rulien’s poster for this GIS tool won best analytical data presentation at 2019’s WAURISA Conference. Check it out here.

Talking Field Data Collection at 2019 OCEAN Connect Conference on April 11

Over the past decade or two, technological advancements have presented opportunities to streamline field data collection. However, migrating field staff to a paperless workflow requires more than choosing the right software and hardware.

On April 11, Aspect’s John Warinner and Robyn Pepin will cover this topic and give tips on how to effectively convert field data collection from paper to digital process at the 2018 Oregon Conservation Education and Assistance Network (OCEAN) Connect Conference in Sunriver, Oregon.

Key areas of the presentation will include:

  • Overview of commercial off-the-shelf software and reporting systems

  • Case studies and lessons learned by Aspect’s field and data teams

  • Successful talking points to convince decision makers

See good field techniques and analysis put into practice, with some mountain biking thrown in for good measure here:

It's IPAD Mini vs. Trimble GPS in a mapmaking showdown on the sunny trails of the Chelan-Douglas Land Trust in the Wenatchee Valley.

And read more about our experience with how one suite of field data technology has improved our workflow.


November 1 at NWGIS 2018: The Art of the Helpful GIS Presentation

Associate Data Scientist Parker Wittman and Senior Geospatial Data Scientist Blair Deaver will be on a panel — “The Art of the Helpful GIS Presentation” — this Thursday at NWGIS 2018 in Bremerton. The four-person panel presents on tips and techniques to deliver a GIS presentation at a conference or at the office.  Parker will discuss ways to improve the delivery of a presentation and Blair will present on tips to master a successful technical demonstration.

ESRI President Jack Dangermond is giving the highly anticipated keynote speech at this year’s conference on the future of GIS.

Visualizing Stormwater Infiltration + Visualizing the Story

Aspect recently led a first-of-its-kind approach to help the City of SeaTac (City) understand water quality requirements at the land use planning stage. Aspect, along with Robin Kirschbaum, developed publicly-available webmaps that visualize stormwater infiltration potential at a parcel level across the City’s 10 square miles. These maps will help both City planners as well as developers screen development options with infiltration requirements and make this step of the land use planning process much more efficient.

Take a look at the interactive Story Map for this exciting new tool here: https://maps.aspectconsulting.com/lidmapjournal/index.html.

Read Emelie’s article in the Daily Journal of Commerce about this pioneering project.

Meet Mike Mills

Mike Mills recently joined Aspect's Portland, Oregon office.  Here are five questions we asked to get to know him better.

Mike Mills, Project Software Developer

1.    Where are you from? If you’re not from the Pacific Northwest, what brought you here? 

I was born in Portland Oregon, but grew up in Sisters, Oregon (just north of Bend).  

2.    What inspired you to pursue software development? What made you curious about it?

I learned how to code my freshman year of high school and from then on knew exactly what I wanted to do with my professional life. 

3.    What do you like best about your area of expertise? What excites you and keeps you motivated? 

I really enjoy solving complex problems, which coding allows me to do with ease. The thing that excites me the most is to finish a project and have a client be completely satisfied with the work that’s been done. 

4.    What do you like to do when you aren’t working? 

When I‘m not working, I enjoy running around the Portland waterfront and reading with my wife. I also enjoy salmon fishing every season with my Dad and Mom in Newport, Oregon. 

5.    Where in the world would you like to travel next? 

After visiting Italy this last October, I would love to go back to Europe and visit either France or Spain. My wife speaks French, so that would be a bonus having a translator. 
 

Meet Chris Bellusci and Blair Deaver

Chris Bellusci and Blair Deaver recently joined Aspect's Bend, Oregon office.  Here are five questions we asked to get to know them better.

Chris Bellusci, Associate Business Systems Architect

Chris hiking near the Maroon Bells -- two peaks in the Elk Mountains in Colorado.

1.    Where are you from? If you’re not from the Pacific Northwest, what brought you here? 

I was born and raised in Missoula, Montana on a small ranch, where I developed my love for the outdoors and our natural resources. From Missoula, I moved to Seattle where I spent 10 years going to school, working, and exploring all the great outdoor activity it had to offer. But I felt I needed to get back to something a bit smaller in city size (and more sunshine) so I moved to Bend, Oregon, a place I really call home and have loved it ever since. 

2.    What inspired you to pursue data infrastructure? What made you curious about it?

My degree is in Electrical Engineering, but my first job right out of school was for Boeing Aerospace where I supported the hardware and software that developed the first design-by-wire aircraft, the 777. I saw the power of how technology can revolutionize an industry or a way of doing business. This set my path into the world of software. 

3.    What do you like best about your area of expertise? What excites you and keeps you motivated?

My focus is helping industries solve their complex business problems by applying technology solutions. My real belief is business process should drive the technology approach, which is why I enjoy learning so much about our client’s business and helping them to find the best solution to meet their business needs. I believe that applying technology to better manage our natural resources is the next great frontier.

4.    What do you like to do when you aren’t working? 

Being outside!!! I love Bend because of the four seasons it has to offer and I love being outside in each one of them, whether if it’s 90 degrees in July or 10 degrees in January. Hiking, biking, camping, skiing--I enjoy all of it!  

5.    Where in the world would you like to travel next? 

It has been over 15 years since I have visited Europe and I would like to get back there again this time with our two children. I would like them to see and experience other cultures, plus I have an older brother that lives in London, UK, so a good excuse to go.

Blair Deaver, Senior Geospatial Data Scientist

Blair riding the Jem biking trail in Utah.

1.    Where are you from? If you’re not from the Pacific Northwest, what brought you here? 

I grew up in Washington, D.C. I fled west for college in search of real mountain ranges I could explore on my mountain bike.

2.    What inspired you to pursue GIS and IT? What made you curious about it?

When I was going to school at the University of Oregon I worked part-time for the US Forest Service as a Hydro-technician in Oakridge, OR. I was a seasonal employee with aspirations for a full-time field job.  I quickly determined that a full-time job would be difficult. A peer at the time mentioned to me that if he were me, he would learn everything there is to know about this thing called “GIS”.  I quickly transitioned much of my school focus to Geography and GIS.  I was fascinated by GIS and quickly learned all I could.  When I graduated college, I was fortunate to get a job at Esri in Redlands, CA. I went from working in the woods for 10 hours a day to helping Esri customers solve technical problems behind a desk. The transition was a bit rough at first, but I have loved every minute of it. 

3.    What do you like best about your area of expertise? What excites you and keeps you motivated? 

I love the pairing of earth science + technology to solve real problems. I enjoy working with others to focus on the mastery of understanding a problem rather than quickly jumping to an engineering solution. I have worked over 20 years in the geospatial and IT industry. I have seen lots of change in the industry. What motivates me daily is to always keep learning. Being able to design and deliver technology solutions for earth science customers requires technical agility, creativity, and a solid understanding of the problem you are trying to solve.

4.    What do you like to do when you aren’t working? 

I love being a father and husband. You may also find me riding and racing my bicycle on trails throughout the PNW. I also love trail running and winter sport activities.

5.    Where in the world would you like to travel next? 

I would love to travel to Africa. All parts of Africa. I better save up my vacation.
 

New LiDAR Maps Reveal Skagit County's Geologic Landscape

LiDAR mapping – the process of methodically using pulsed lasers from a plane/helicopter to map aerial-view landscape features – helps communities plan for landslide hazards, understand potential floodplains, and learn about geologic features previously unknown. Because LiDAR penetrates through tree canopies, it produces much greater detail and precision than typical aerial maps. So, when new LiDAR maps are released (particularly in areas with heavy tree cover, thus meaning much longer lead times to create new maps) – it is a cause for excitement in the earth science and geographic information system (GIS) communities.

Skagit County just finished a year-long LiDAR mapping project of the county and produced a great new story map that reveals features--including a prehistoric landslide near Cultus Mountain – that were not apparent on the previous aerial maps.

The region’s first generation of LiDAR maps was a tremendous advancement over the aerial photo-based survey maps that had been used for generations. While very useful, the limitations in quality of the older LiDAR was most apparent in steep and heavily vegetated areas – frustrating because those are exactly the areas where you most want the best data. The greater detail and accuracy of this new generation of LiDAR maps presents a leap forward in resolution and ability to survey these important areas. 

Compare the quality of the 2006 LiDAR map of Guemes Island (left) to the new version (right)

The new generation also frequently includes “green light LiDAR”, a method with the ability to penetrate water and reveal the bathymetry of shorelines, streams, rivers, and other shallow water bodies.  Both of these improvements greatly improve our ability to rely on the new LiDAR maps for interpretation of geomorphic features and active processes, and detect natural and human-caused changes in the environment. 

Take a look: Skagit Lidar Map Journal

Aspect’s Growing Data Science and Mapping Services

Science and engineering insights fueled, managed, and clearly communicated through technology. 

This sums up Aspect's successful client-focused approach since our inception in 2001. This year, we’ve enhanced the technology piece of this formula by adding three new staff, with over 10 years working together, focused on software development, technology integration, and geospatial data science. Chris Bellusci, Associate Business Systems Architect, and Blair Deaver, Senior Geospatial Data Scientist join Aspect’s recently opened Bend, Oregon office; and Mike Mills, Senior Project Software Developer, joins Aspect’s growing Portland, Oregon office.

These three will enhance Aspect’s already robust Data + Mapping services—helping our clients and project teams with solutions like map-integrated stormwater monitoring dashboards; environmental data management system design and integration; technology needs assessment and road-mapping; web map and GIS application development; integrated systems for mobile field data collection; and the development of machine learning-based approaches to basin-scale hydrology issues.

Data + Mapping Practice Lead and Aspect’s Director of Professional Services Parker Wittman explains the benefits to clients, “Chris, Blair, and Mike boost our core skills and add industry-leading, sought-after services like web development and cloud-based data management expertise,” Wittman said. “Reflecting the world at large, our clients will continue to seek out solutions that are interactive and mobile-platform friendly, that translate large amounts of data into scientific and business insights. These clients require teams that are analytical high-performers, who speak in the languages of business, regulation, earth science, and technology.”

Chris Bellusci

Chris Bellusci recognizes Aspect as an emerging leader in the data science and mapping world. “Joining Aspect was a clear choice for us. They’ve always partnered their earth engineering and science experts with creative technologists focused on client satisfaction. The three of us (Bellusci, Deaver, and Mills) see a lot of potential to help Aspect’s growing client base,” Bellusci said. “The cloud and web tools we leverage can shrink project times and costs—for example turning a typically three-week monitoring report process into three days. Mountains of data that were tracked by hand previously can now be managed in the cloud and presented to decision makers in minutes instead of weeks.”

Chris has been working in the world of IT/software development, support, and product management for more than 20 years, with an educational background in Electrical Engineering. For the past 12 of those years, Chris has been helping clients plan for and build technology-driven solutions related to earth science problems. He is a seasoned project and client manager with a penchant for new business development. 

Blair Deaver

Blair Deaver’s educational background is in Environmental Studies and GIS. His geospatial expertise is both broad (everything from open source GIS, scripting, mobile development, dev ops, data management, enterprise IT) and deep—he is a recognized Esri GIS expert and is Amazon Web Services certified. Blair is known for an incredibly nimble style of problem-solving, a trait that meshes well with Aspect’s overall approach to client services. 

Mike Mills

Mike Mills’s core expertise/background is in web and database development—he’s done everything from statistical analysis (writing custom kriging algorithms for in-browser spatial analyses) to mobile application development.  He’s a full-stack developer with a decade of experience delivering solutions for earth science and engineering projects. Mike’s educational background is in Mathematics and Computer Science.

Chris, Blair, and Mike all joined Aspect from GeoEngineers, where they had previously worked as a team for the better part of 10 years. Together—with Associate Water Resources Engineer, John Warinner—Chris and Blair make up Aspect’s new Bend, Oregon office. With Mike joining Aspect’s growing Portland office as well, Aspect is continuing its earnest expansion into the Oregon earth + water market. The experts who are part of Aspect emerging Oregon presence service all the firm’s core practice areas—and are collectively a reflection of Aspect’s multidisciplinary approach.


The Story of a 106-Year-Old Northwest Map Making Institution

The color of the water is off; it’s too dark. So he prints the map three more times, each time adjusting a small detail.”  

Yup, that’s map making. Aspect's mapping team was nodding along to this touching Seattle Times story about a 106-year-old map-making business. We’ve had a Kroll map hanging in the office ever since Aspect’s early days for motivation and inspiration. It serves as an important reminder that you never know the longevity and influence the maps you create just might have, even the little details have to be just right.

The Kroll map hanging in Aspect's Seattle office

The Beauty and Power of LiDAR in Geology

Kudos to the good people at the Washington State Department of Natural Resources (DNR)/Washington Geological Survey for their absolutely incredible Esri Story Map, The Bare Earth.

Here at Aspect, we use regional LiDAR data treasure troves nearly every single day. From landslide hazard analysis, to stormwater infiltration feasibility, to fault identification and mapping–our team of geologists and GIS analysts are well familiar with the power of this incredible, rich data.  

However, we've never seen such a thoughtful, thorough, and beautiful presentation of LiDAR's role in geology as this. In addition to the breathtaking LiDAR visualizations, it's a wonderful example of the narrative and explanatory power of a story map

Bravo, DNR. Bravo.

...oh... and happy GIS Day/Post-GIS Day! This is a wonderful way to celebrate.