Data Teams as Gatekeepers to Unlock Brownfield Cleanups

Environmental data teams methodically confirm cleanup levels and visualize the 'cleanup finish line' with the regulatory criteria and client end goals

What is the measure of ‘clean’ at brownfield sites? Before any digging of contaminated dirt or treatment of contaminated groundwater, there is much upfront work by regulators and project teams – chemists, data analysts, geologists, engineers, and more – to determine the appropriate cleanup levels to use for a given site. The cleanup levels are the north star that every brownfield cleanup team steers by.

To Succeed, Be Sure What ‘Clean’ Looks Like

Aspect’s environmental data team regularly keeps the finger on the pulse of regulatory databases and uses tools – such as the open-source programming language R – to streamline brownfield cleanup projects.

Using R to automate screening level updates allows project teams to:

  • Make changes quickly and confidently

  • Minimize the risk of errors and omissions

  • Provide much-improved process transparency

  • Streamline communications across the project team

Keeping up on the best available science gives project managers greater assurance that their sites are being appropriately measured against regulatory criteria, providing a smoother path forward in the management and remediation of contaminated sites.

A Peek into Regulatory Data World with CLARC

CLARC is the Washington State Department of Ecology’s (Ecology) Cleanup Levels and Risk Calculation spreadsheet that is the basis for calculating cleanup levels under Ecology’s Model Toxics Control Act (MTCA). MTCA is Washington state’s cleanup rule which governs over 13,000+ known or suspected contaminated sites. CLARC is a key measure of what defines success at these cleanup projects and a living document that is maintained and updated by Ecology, as needed, with major updates every six months to align with changes to state and federal regulatory (e.g., US Environmental Protection Agency (EPA)) criteria.

Aspect engineer evaluating a vapor intrusion system at Art Brass Plating – a South Seattle cleanup site. The measure of success for these systems — and projects — rely on knowing the correct and up-to-date cleanup level criteria

The data tables in CLARC provide the various input parameters used to calculate screening levels for a huge array of chemicals in soil, groundwater, surface water, soil gas, and air—as well as the resulting calculated cleanup level values themselves. The calculated values are routinely used by remediation project managers to screen analytical results (from samples collected in the field) against federal, state, or other regulatory thresholds.

What is R and How Does it Accurately Automate Away Manual Data Entry?

R is an open-source software environment used for statistical computing and graphics. Recently, Aspect’s data team wrote a package of R code to use CLARC’s input parameters to calculate a suite of specific screening levels. The same code can be run any time the input values in CLARC are updated, generating quality assurance tables to alert Aspect’s data team of potential issues, and providing summary tables for Aspect project managers to review cleanup level changes and consider their potential impact to their various environmental sites.

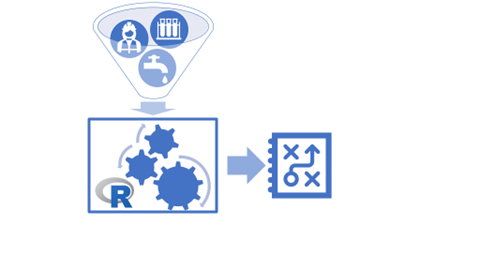
Various input parameters, including regulatory requirements, chemistry, site use, human safety and environmental quality are entered into our custom R tool to make and maintain a reliable, reproducible metric set for project success

Since there are usually screening levels for hundreds of different analytes at remediation cleanups  – e.g., petroleum and diesel, arsenic, tetrachloroethylene and more – when the CLARC database is updated by the regulator, it can be difficult to see if there have been any changes and which analytes may have been affected.

Aspect uses the industry standard EQuiS environmental data management system. The R tool helps us better use EQuIS to manage and screen environmental data against cleanup levels. Before using R, preparing CLARC-based screening and cleanup levels for upload to EQuIS required tedious data wrangling in Excel and institutional knowledge of what analytes should be compared to which screening levels. With R, the process involves little more than a click of a button

Data Problem Solving that Makes Remediation Easier

R simplifying the complexity of the brownfield cleanup level process

Brownfield remediation cleanups require imagining a range of scenarios for the future use of a ‘clean’ property. Will the site be used for residential, commercial, or industrial purposes? What pollutants are present and where? It all starts with the cleanup level criteria.

Overall, this work by Aspect’s data team – who are meticulous at knowing the state-of-the-science regulatory criteria – ensures Aspect’s project teams have the correct screening or cleanup levels based on the most current toxicity guidance, which helps avoid rework later on in the process and saves time and money for the client.

Meet Katie Sultani-Wright and Scott Mortensen

Aspect recently welcomed Katie Sultani-Wright and Scott Mortensen to our Seattle office. Here are Five Questions we asked to get to know them better…

Katie Sultani-Wright, Practice Coordinator

First camping trip with the five of us at Birch Bay, near Bellingham

  1. Where are you from? If you’re not from the Pacific Northwest, what brought you here?

    I was born in Washington, DC, and have been making my way west ever since.  I’ve lived in DC, Maryland, Colorado, Michigan, Alaska, and Washington State.  I came to Seattle for a job after college.  Graduating as a naval architect/ocean engineer, being near water was, well, a requirement.  I currently live in West Seattle.   

  2. What inspired you to pursue project management? What made you curious about it?

    I don’t know that I pursued project management, I think it’s more like project management pursued me!  Being a consulting engineer, effective project management is a critical skill and a huge part of good client service.  For me, Operations is a natural extension of project management — there are even more moving pieces and the work is never done.  I like that I get to work hard and there is always something to learn. 

  3. What do you like best about your area of expertise? What excites you and keeps you motivated?

    I like the fact that I get to support others!  I love being a part of systems and processes that enable my colleagues to do their best work.  I am motivated by continuous improvement.  How can we challenge ourselves to do better?  Let’s do it!

  4.  What do you like to do when you aren’t working?

    I like to spend time with my spouse (Jon) and our three children.  I like to read books — business, sci-fi, fantasy, survival/disaster.  I like puzzles, especially crosswords and jigsaw.  I like to be outside.  My kids and I have fun playing Nintendo games together.  Music is what brought Jon and I together, so we enjoy going to shows on the off chance that we find someone willing to take care of our kids for an evening.

  5.  What five people would be your dream dinner party guests?

     ABBA!  And I suppose I’d invite Jon, too.  

Scott Mortensen, Staff GIS Analyst

Hiking in California

Hiking in California

  1. Where are you from? If you’re not from the Pacific Northwest, what brought you here?

    I am from the PNW but a little more NW than Seattle; I’m from Anchorage, AK. After more than a decade of moving around as a young adult, I suppose I felt drawn to reconnect with my PNW roots and be closer to family.

  2. What inspired you to pursue GIS? What made you curious about it?

    GIS was something I was first exposed to while surveying gravity-fed aqueduct systems as a Peace Corps Volunteer in Panama. I was drawn to the technical skill and the practical application of data management, manipulation, and visualization as a tool for decision-making and communication.

  3.  What do you like best about your area of expertise? What excites you and keeps you motivated?

    I like the combination of fieldwork + office work and the balance of the analytical left brain + creative right brain. GIS seems to always be evolving so there’s never a dearth of things to learn.

  4. What do you like to do when you aren’t working?

    Relationships are the most important thing to me and I highly value having an active lifestyle, so I spend a good deal of my free time combining those things: spending time with friends and family backpacking, cycling, working on house projects, and cooking. I like to read and am learning to play the harmonica.

  5.  If you were given $50,000 to donate to any cause what cause would you choose?

    Increasing access to high-quality education is the cause that I would most like to dedicate resources towards.

Robyn Pepin and Spencer Ambauen Talk Fish Habitat Solutions at River Restoration Northwest

The 19th annual River Restoration Northwest symposium is this week in Stevenson, Washington. Representatives from Aspect’s Seattle, Wenatchee, and Portland offices are attending to cheer on presentations by two of our colleagues focused on removing fish passage barriers in the Pacific Northwest.

Senior GIS Analyst Robyn Pepin’s presentation “Data-Driven Decision Making: An Innovative Prioritization Tool for Restoration (and more!)” showcases the methodology behind the GIS-based tool she created in partnership with the Upper Columbia Salmon Recovery Board that synthesizes and streamlines numerous data sets to prioritize what barriers are most need of removal in the Wenatchee Basin.

Spencer Ambauen is presenting his poster on the Geosynthetic Reinforced Soil-Integrated Bridge System (GRS-IBS). This bridge construction system is made from alternates layers of compacted structural fill soils and a mesh-like geosynthetic reinforcement that can be used in many subsurface and seismic conditions. For public agencies looking to replace hundreds of aging, undersized culverts and other structures hindering riparian habitat, GRS-IBS bridges are a less expensive option that are easier to construct and maintain. These bridges becoming more common across the east coast, but so far there have been only two constructed in Washington state. Spencer is well familiar with the GRS-IBS system; masters thesis involved numerical modeling to evaluate how these bridges behave under surcharge loading, and he completed design for an GRS-IBS bridge for the Washington State Department of Fish and Wildlife to enhance fish passage at Tolmie State Park near Olympia.

Robyn Pepin Talks Fish Passage Barrier Prioritization on GIS Podcast

Senior GIS Analyst Robyn Pepin was recently a guest on the GIS-focused podcast Will We Make it Out Alive?

In an episode titled “A Culvert Affair,” hosts Amy and Jen talked with Robyn about the Fish Passage Barrier Prioritization Tool she developed for the Upper Salmon Recovery Board to prioritize which culverts and other obstructions blocking fish passage should be removed first, and how she continues to adapt and improve it as needed for other agencies. Robyn also walks listeners the Flow Network tools she used to create the tool.

Listen to Robyn and other episodes of the podcast here.

How to Deliver More Successful GIS Outreach Campaigns at NW GIS in Bend

Conducting a successful public outreach and/or marketing campaign using GIS is more involved than just publishing a web-map. Marketing, communication, design professionals, and a wide range of other professionals are increasingly seeing the value of map-based infographics to promote marketing and communication campaigns. Aspect’s Blair Deaver recently presented at the Northwest GIS User Group on how to conduct a successful marketing campaign that involves GIS. Blair has developed successful story map campaigns and he brought his experience on those to propose marketing tips outside of simply publishing your web map such as:

  • Messaging and Audience

  • SEO/SEM considerations

  • Engagement with marketing, communication, and management colleagues

  • Increasing Virality

  • Measuring Impact

In addition to Blair’s presentation, Aspect’s GIS crew was thrilled to learn their fish passage poster presentation — visualizing Aspect’s fish passage removal GIS tool — won the award for “Best Analysis.”

From left, Parker Wittman, Robyn Pepin, Emelie Crumbaker, and Blair Deaver

Learn more about the conference here.

New GIS Tool Helps Remove Barriers to Salmon Habitat Connectivity

Clean, cold water. Lush riparian vegetation. Gravels for spawning. These are some of the elements that create healthy habitat for salmon. The Upper Columbia region has some of the best in the Pacific Northwest. Unfortunately, not all of this habitat is within the salmon’s reach. Removing barriers such as culverts and dams is a top priority for salmon recovery goals, but there are thousands of barriers, limited resources to remove them, and a diverse group of stakeholders with issues to address. What everyone wants to know first is: how do we decide WHICH barriers to remove?

Instream barriers such as culverts like this can limit fish passage to available habitat.

Enter a New Tool for Fish Habitat Decision Making

In partnership with the Cascade Columbia Fisheries Enhancement Group, the Upper Columbia Salmon Recovery Board, the Upper Columbia Regional Technical Team (RTT), and a technical steering committee, Aspect created a GIS-based decision support tool that summarizes the overall quality of ecological conditions surrounding each instream barrier within the Wenatchee Basin. This custom spatial model provides insight into critical questions regarding barrier-removal priority:

  • Is there habitat available upstream from the barrier that salmon currently cannot access?

  • Is that available habitat of sufficient quality for salmon?

  • Is there known fish usage near the barrier already?

  • Are there barriers downstream blocking fish access?

This prioritization tool provides salmon-recovery stakeholders with a common approach to answer these questions. The variables under consideration at a barrier—upstream habitat quality, local stream temperature, connectivity to other barriers, etc.—each receive a score. Those scores are then added up to a total priority tier ranking for that barrier. By assessing each barrier through this scoring process, we’ve created an actionable apples-to-apples comparison of habitat benefits associated with barrier removal.

A preview of barrier removal ranking priority data.

A Tier 1 ranking indicates the top priority for removal, indicating more biological benefit gained from a barrier’s removal. Tier 4 ranking is the lowest priority ranking, indicating little biological benefit gained from a barrier’s removal. UCSRB and the RTT use these categories to guide decisions on proposed project funding. The rankings are updated as available data sources improve.  Preview the results HERE. This tool will allow stakeholders to align and coordinate their barrier removal work towards the larger common goal of salmon-habitat connectivity within the Upper Columbia and throughout the state.

If interested in adapting this tool for your project and/or basin(s), contact Robyn Pepin for more information.

ETA (6/3/2019): Robyn Pepin and Taylor Rulien’s poster for this GIS tool won best analytical data presentation at 2019’s WAURISA Conference. Check it out here.

Talking Field Data Collection at 2019 OCEAN Connect Conference on April 11

Over the past decade or two, technological advancements have presented opportunities to streamline field data collection. However, migrating field staff to a paperless workflow requires more than choosing the right software and hardware.

On April 11, Aspect’s John Warinner and Robyn Pepin will cover this topic and give tips on how to effectively convert field data collection from paper to digital process at the 2018 Oregon Conservation Education and Assistance Network (OCEAN) Connect Conference in Sunriver, Oregon.

Key areas of the presentation will include:

  • Overview of commercial off-the-shelf software and reporting systems

  • Case studies and lessons learned by Aspect’s field and data teams

  • Successful talking points to convince decision makers

See good field techniques and analysis put into practice, with some mountain biking thrown in for good measure here:

It's IPAD Mini vs. Trimble GPS in a mapmaking showdown on the sunny trails of the Chelan-Douglas Land Trust in the Wenatchee Valley.

And read more about our experience with how one suite of field data technology has improved our workflow.


November 1 at NWGIS 2018: The Art of the Helpful GIS Presentation

Associate Data Scientist Parker Wittman and Senior Geospatial Data Scientist Blair Deaver will be on a panel — “The Art of the Helpful GIS Presentation” — this Thursday at NWGIS 2018 in Bremerton. The four-person panel presents on tips and techniques to deliver a GIS presentation at a conference or at the office.  Parker will discuss ways to improve the delivery of a presentation and Blair will present on tips to master a successful technical demonstration.

ESRI President Jack Dangermond is giving the highly anticipated keynote speech at this year’s conference on the future of GIS.

Visualizing Stormwater Infiltration + Visualizing the Story

Aspect recently led a first-of-its-kind approach to help the City of SeaTac (City) understand water quality requirements at the land use planning stage. Aspect, along with Robin Kirschbaum, developed publicly-available webmaps that visualize stormwater infiltration potential at a parcel level across the City’s 10 square miles. These maps will help both City planners as well as developers screen development options with infiltration requirements and make this step of the land use planning process much more efficient.

Take a look at the interactive Story Map for this exciting new tool here: https://maps.aspectconsulting.com/lidmapjournal/index.html.

Read Emelie’s article in the Daily Journal of Commerce about this pioneering project.

Meet Chris Bellusci and Blair Deaver

Chris Bellusci and Blair Deaver recently joined Aspect's Bend, Oregon office.  Here are five questions we asked to get to know them better.

Chris Bellusci, Associate Business Systems Architect

Chris hiking near the Maroon Bells -- two peaks in the Elk Mountains in Colorado.

1.    Where are you from? If you’re not from the Pacific Northwest, what brought you here? 

I was born and raised in Missoula, Montana on a small ranch, where I developed my love for the outdoors and our natural resources. From Missoula, I moved to Seattle where I spent 10 years going to school, working, and exploring all the great outdoor activity it had to offer. But I felt I needed to get back to something a bit smaller in city size (and more sunshine) so I moved to Bend, Oregon, a place I really call home and have loved it ever since. 

2.    What inspired you to pursue data infrastructure? What made you curious about it?

My degree is in Electrical Engineering, but my first job right out of school was for Boeing Aerospace where I supported the hardware and software that developed the first design-by-wire aircraft, the 777. I saw the power of how technology can revolutionize an industry or a way of doing business. This set my path into the world of software. 

3.    What do you like best about your area of expertise? What excites you and keeps you motivated?

My focus is helping industries solve their complex business problems by applying technology solutions. My real belief is business process should drive the technology approach, which is why I enjoy learning so much about our client’s business and helping them to find the best solution to meet their business needs. I believe that applying technology to better manage our natural resources is the next great frontier.

4.    What do you like to do when you aren’t working? 

Being outside!!! I love Bend because of the four seasons it has to offer and I love being outside in each one of them, whether if it’s 90 degrees in July or 10 degrees in January. Hiking, biking, camping, skiing--I enjoy all of it!  

5.    Where in the world would you like to travel next? 

It has been over 15 years since I have visited Europe and I would like to get back there again this time with our two children. I would like them to see and experience other cultures, plus I have an older brother that lives in London, UK, so a good excuse to go.

Blair Deaver, Senior Geospatial Data Scientist

Blair riding the Jem biking trail in Utah.

1.    Where are you from? If you’re not from the Pacific Northwest, what brought you here? 

I grew up in Washington, D.C. I fled west for college in search of real mountain ranges I could explore on my mountain bike.

2.    What inspired you to pursue GIS and IT? What made you curious about it?

When I was going to school at the University of Oregon I worked part-time for the US Forest Service as a Hydro-technician in Oakridge, OR. I was a seasonal employee with aspirations for a full-time field job.  I quickly determined that a full-time job would be difficult. A peer at the time mentioned to me that if he were me, he would learn everything there is to know about this thing called “GIS”.  I quickly transitioned much of my school focus to Geography and GIS.  I was fascinated by GIS and quickly learned all I could.  When I graduated college, I was fortunate to get a job at Esri in Redlands, CA. I went from working in the woods for 10 hours a day to helping Esri customers solve technical problems behind a desk. The transition was a bit rough at first, but I have loved every minute of it. 

3.    What do you like best about your area of expertise? What excites you and keeps you motivated? 

I love the pairing of earth science + technology to solve real problems. I enjoy working with others to focus on the mastery of understanding a problem rather than quickly jumping to an engineering solution. I have worked over 20 years in the geospatial and IT industry. I have seen lots of change in the industry. What motivates me daily is to always keep learning. Being able to design and deliver technology solutions for earth science customers requires technical agility, creativity, and a solid understanding of the problem you are trying to solve.

4.    What do you like to do when you aren’t working? 

I love being a father and husband. You may also find me riding and racing my bicycle on trails throughout the PNW. I also love trail running and winter sport activities.

5.    Where in the world would you like to travel next? 

I would love to travel to Africa. All parts of Africa. I better save up my vacation.
 

Aspect’s Growing Data Science and Mapping Services

Science and engineering insights fueled, managed, and clearly communicated through technology. 

This sums up Aspect's successful client-focused approach since our inception in 2001. This year, we’ve enhanced the technology piece of this formula by adding three new staff, with over 10 years working together, focused on software development, technology integration, and geospatial data science. Chris Bellusci, Associate Business Systems Architect, and Blair Deaver, Senior Geospatial Data Scientist join Aspect’s recently opened Bend, Oregon office; and Mike Mills, Senior Project Software Developer, joins Aspect’s growing Portland, Oregon office.

These three will enhance Aspect’s already robust Data + Mapping services—helping our clients and project teams with solutions like map-integrated stormwater monitoring dashboards; environmental data management system design and integration; technology needs assessment and road-mapping; web map and GIS application development; integrated systems for mobile field data collection; and the development of machine learning-based approaches to basin-scale hydrology issues.

Data + Mapping Practice Lead and Aspect’s Director of Professional Services Parker Wittman explains the benefits to clients, “Chris, Blair, and Mike boost our core skills and add industry-leading, sought-after services like web development and cloud-based data management expertise,” Wittman said. “Reflecting the world at large, our clients will continue to seek out solutions that are interactive and mobile-platform friendly, that translate large amounts of data into scientific and business insights. These clients require teams that are analytical high-performers, who speak in the languages of business, regulation, earth science, and technology.”

Chris Bellusci

Chris Bellusci recognizes Aspect as an emerging leader in the data science and mapping world. “Joining Aspect was a clear choice for us. They’ve always partnered their earth engineering and science experts with creative technologists focused on client satisfaction. The three of us (Bellusci, Deaver, and Mills) see a lot of potential to help Aspect’s growing client base,” Bellusci said. “The cloud and web tools we leverage can shrink project times and costs—for example turning a typically three-week monitoring report process into three days. Mountains of data that were tracked by hand previously can now be managed in the cloud and presented to decision makers in minutes instead of weeks.”

Chris has been working in the world of IT/software development, support, and product management for more than 20 years, with an educational background in Electrical Engineering. For the past 12 of those years, Chris has been helping clients plan for and build technology-driven solutions related to earth science problems. He is a seasoned project and client manager with a penchant for new business development. 

Blair Deaver

Blair Deaver’s educational background is in Environmental Studies and GIS. His geospatial expertise is both broad (everything from open source GIS, scripting, mobile development, dev ops, data management, enterprise IT) and deep—he is a recognized Esri GIS expert and is Amazon Web Services certified. Blair is known for an incredibly nimble style of problem-solving, a trait that meshes well with Aspect’s overall approach to client services. 

Mike Mills

Mike Mills’s core expertise/background is in web and database development—he’s done everything from statistical analysis (writing custom kriging algorithms for in-browser spatial analyses) to mobile application development.  He’s a full-stack developer with a decade of experience delivering solutions for earth science and engineering projects. Mike’s educational background is in Mathematics and Computer Science.

Chris, Blair, and Mike all joined Aspect from GeoEngineers, where they had previously worked as a team for the better part of 10 years. Together—with Associate Water Resources Engineer, John Warinner—Chris and Blair make up Aspect’s new Bend, Oregon office. With Mike joining Aspect’s growing Portland office as well, Aspect is continuing its earnest expansion into the Oregon earth + water market. The experts who are part of Aspect emerging Oregon presence service all the firm’s core practice areas—and are collectively a reflection of Aspect’s multidisciplinary approach.


The Beauty and Power of LiDAR in Geology

Kudos to the good people at the Washington State Department of Natural Resources (DNR)/Washington Geological Survey for their absolutely incredible Esri Story Map, The Bare Earth.

Here at Aspect, we use regional LiDAR data treasure troves nearly every single day. From landslide hazard analysis, to stormwater infiltration feasibility, to fault identification and mapping–our team of geologists and GIS analysts are well familiar with the power of this incredible, rich data.  

However, we've never seen such a thoughtful, thorough, and beautiful presentation of LiDAR's role in geology as this. In addition to the breathtaking LiDAR visualizations, it's a wonderful example of the narrative and explanatory power of a story map

Bravo, DNR. Bravo.

...oh... and happy GIS Day/Post-GIS Day! This is a wonderful way to celebrate.

Meet Caroline Van Slyke

Caroline Van Slyke recently joined Aspect's Seattle office. Here are five questions we asked to get to know her better.

    Caroline Van Slyke, Senior CAD Specialist

    1. Where are you from?

    I hail from a small town in northeast Ohio that had one stop light. We lived on a dirt road and couldn’t see the neighbor’s house because it was too far away.  After years of high humidity, winter blizzards, and lake-effect snow, I packed everything up and headed west to the Emerald City of Seattle.  I’ve been here for almost 30 years and never tire of this beautiful state.

    2.    What inspired you to pursue CAD? What made you curious about it?

    To me, CAD wouldn’t exist if drafting never existed. One of the classes I took during my senior year in high school was a drafting class where we used pencils and T-squares because CAD did not exist.  The subject matter came very easily and as a result, I was put into a small subset of students affectionately named “All You Others” that did advanced studies while the rest of the class followed the standard curriculum.  it was so enjoyable that I decided to pursue an AA in Mechanical Engineering.

    3.    What do you like best about your area of expertise? What excites you and keeps you motivated? 

    Every day, there is something new and exciting to work on!  Over my career, I have helped engineering professionals with many different projects spanning all engineering disciplines, which affords exciting learning opportunities daily.  It’s fun to have a pulse on the Puget Sound region by way of being involved with projects in our line of work.

    4.    What do you like to do when you aren’t working? 

    I secretly rock out and play the blues on my guitar and when it’s not raining, drive my car around the track at Pacific Northwest Raceways at high velocities.  I also indulge in video games when time permits.

    5.    What is the most unusual thing in your wallet, pocket, or purse right at this moment?

    Just for conversation starters, I have a 45-rpm record adapter that I will occasionally show to a post-vinyl record era person and see if they can guess what it is.
     

    Visualizing the Gender Wage Gap at the 2017 ESRI Conference

    In the map-making world of Geographic Information Systems (GIS), ESRI is the de facto software of the industry. To keep up on all things GIS-related, Aspect’s GIS crew attends conference and networking events, including this year’s annual ESRI User Conference in San Diego.

    Aspect's Senior GIS Analyst Robyn Pepin (far left), other members of WWGT, and ESRI President Jack Dangermond (middle) at the 2017 ESRI User Conference.

    This year, Senior GIS Analyst Robyn Pepin attended the conference representing both Aspect and Washington Women in GIS and Technology (WWGT). Several members of Aspect’s GIS staff participate in WWGT -- a group who together promote a diverse work community by providing support and opportunity for women to advance their spatial careers. 

    At this year’s conference, WWGT submitted a poster to ESRI’s annual contest: Washington State Gender Wage Gap in the Work Force. This poster was designed to encourage a data-driven conversation surrounding the gender wage gap and included the history of women’s contribution to the technology field. Aspect’s Kaitlin Schrup contributed a historical timeline graphic to the poster, and Robyn Pepin presented the group’s poster with other WWGT members

    To learn more about WWGT, check out their Facebook page: https://www.facebook.com/WashingtonWomeninGISandTechnology/ 

    Check out a story map about the poster here: http://pot.maps.arcgis.com/apps/Cascade/index.html?appid=9978dbd4bbb94c338b32bbb5f08430d7
     

    Lea Beard Talks Tableau and EQuIS at ICEDM in Oregon

    Aspect’s Lea Beard was invited to speak at the 7th Annual International Conference for Environmental Data Management (ICEDM) this week in Oregon.  Lea’s talk is on using environmental data management systems such as EQuIS in conjunction with powerful graphical analytics systems like Tableau to easily produce reliable, beautiful insights into data.


    GIS Day Roundup

    Aspect commemorated GIS Day, a part of Geography Awareness Week, with a spirited celebration featuring maps, trivia, and cake. 

    The festivities kicked off with a presentation by Senior Data Scientist Parker Wittman, highlighting some of the GIS team’s work over the last year. They have developed innovations using Fulcrum in concert with Google Earth, EQuIS, and other software to make field testing, sampling, and reporting much more efficient. Citing specific work Aspect has done for the Port of Seattle at SeaTac Airport, Parker demonstrated how the systems we’ve created are helping the Port assess the potential impacts proposed construction/redevelopment would have on the existing stormwater infrastructure and keep the existing mass of ever-updating data organized and easily accessible. Our team is strategically employing automated tools where it can save projects time and money.

    Later in the day, we cut the cake as the GIS team set out to stump the rest of us with several rounds of GIS / geography-related trivia questions. 

    Of course, a GIS Day celebration would not be complete without an informative map. The GIS team polled staffers on all the places they’ve lived throughout their lives. Using the analytical software Tableau, they created this lovely lattice crisscrossing the world. 

    Field Data Collection Goes Mobile

    It’s already difficult to imagine doing it any other way.

    At Aspect, we collect data. Lots and lots of data. We collect notes, measurements, GPS coordinates, photos, field observations, asset inventories, and on and on. All of the information we collect is almost always tied to some sort of spot on the earth: a well, a catch basin, a stream gage, a geotechnical boring. All the projects and people and paper and files and handwriting – it’s a lot to manage. Doing things the “old-fashioned way” means compiling and collating paper forms, JPEGs, and data files. It means entering notes from the field into a computer back in the office. It means playing a game of “telephone” with our data. It means time (and money!) for our clients.

    Enter: Fulcrum.

    We’ve installed Fulcrum software on mobile phones and a stable of tablets to help manage, organize, and execute our large, complex sampling and field data collection efforts. It enables us to create interactive, spatially-aware forms that help expedite projects and contribute to accurate, clean, and professional work-products. We’re ensuring that the data we collect is consistent and that photos, coordinates, and information we gather stays connected. As simple as that sounds, it means incredible gains for our projects and measurable benefits for our clients.

    Here are a few of the features that we love:

    • At the click of a button, in real-time, field data can be downloaded in the office – enabling office staff to develop maps and analyze data as it is being collected.
    • Data can be downloaded in many file formats to support the specific needs of an individual project (Excel, CSV, GIS Shapefiles, Google Earth KML, etc.).
    • Data requirements and dropdown menus can be established for any or all fields on the form – ensuring consistent, site-specific information is collected.
    • Forms can be built to evolve as data is entered – improving the usability for field staff.
    • Data can be checked and validated on-the-fly – giving field teams real-time feedback and guidance on the collected data.
    • Calculations are built-in and automatic – which saves time and prevents calculation error.
    • Photos, videos, and audio can be collected as a part of each form – intrinsically linking those files with the locations which they document.
    • Locations and any known data can be pre-loaded to the forms – which means field staff can figure out where they need to go and what they need to know in one place.

    With Fulcrum, since mobile field data collection is finally flexible and feature-rich, easy to deploy, and easy to use, we’re recommending it for use in many of our new and existing projects.

    See how it looks in the gallery below.