Environmental data teams methodically confirm cleanup levels and visualize the 'cleanup finish line' with the regulatory criteria and client end goals
What is the measure of ‘clean’ at brownfield sites? Before any digging of contaminated dirt or treatment of contaminated groundwater, there is much upfront work by regulators and project teams – chemists, data analysts, geologists, engineers, and more – to determine the appropriate cleanup levels to use for a given site. The cleanup levels are the north star that every brownfield cleanup team steers by.
To Succeed, Be Sure What ‘Clean’ Looks Like
Aspect’s environmental data team regularly keeps the finger on the pulse of regulatory databases and uses tools – such as the open-source programming language R – to streamline brownfield cleanup projects.
Using R to automate screening level updates allows project teams to:
Make changes quickly and confidently
Minimize the risk of errors and omissions
Provide much-improved process transparency
Streamline communications across the project team
Keeping up on the best available science gives project managers greater assurance that their sites are being appropriately measured against regulatory criteria, providing a smoother path forward in the management and remediation of contaminated sites.
A Peek into Regulatory Data World with CLARC
CLARC is the Washington State Department of Ecology’s (Ecology) Cleanup Levels and Risk Calculation spreadsheet that is the basis for calculating cleanup levels under Ecology’s Model Toxics Control Act (MTCA). MTCA is Washington state’s cleanup rule which governs over 13,000+ known or suspected contaminated sites. CLARC is a key measure of what defines success at these cleanup projects and a living document that is maintained and updated by Ecology, as needed, with major updates every six months to align with changes to state and federal regulatory (e.g., US Environmental Protection Agency (EPA)) criteria.
Aspect engineer evaluating a vapor intrusion system at Art Brass Plating – a South Seattle cleanup site. The measure of success for these systems — and projects — rely on knowing the correct and up-to-date cleanup level criteria
The data tables in CLARC provide the various input parameters used to calculate screening levels for a huge array of chemicals in soil, groundwater, surface water, soil gas, and air—as well as the resulting calculated cleanup level values themselves. The calculated values are routinely used by remediation project managers to screen analytical results (from samples collected in the field) against federal, state, or other regulatory thresholds.
What is R and How Does it Accurately Automate Away Manual Data Entry?
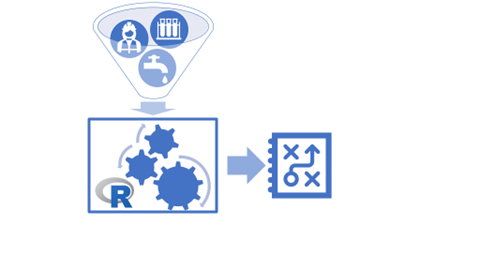
R is an open-source software environment used for statistical computing and graphics. Recently, Aspect’s data team wrote a package of R code to use CLARC’s input parameters to calculate a suite of specific screening levels. The same code can be run any time the input values in CLARC are updated, generating quality assurance tables to alert Aspect’s data team of potential issues, and providing summary tables for Aspect project managers to review cleanup level changes and consider their potential impact to their various environmental sites.
Various input parameters, including regulatory requirements, chemistry, site use, human safety and environmental quality are entered into our custom R tool to make and maintain a reliable, reproducible metric set for project success
Since there are usually screening levels for hundreds of different analytes at remediation cleanups – e.g., petroleum and diesel, arsenic, tetrachloroethylene and more – when the CLARC database is updated by the regulator, it can be difficult to see if there have been any changes and which analytes may have been affected.
Aspect uses the industry standard EQuiS environmental data management system. The R tool helps us better use EQuIS to manage and screen environmental data against cleanup levels. Before using R, preparing CLARC-based screening and cleanup levels for upload to EQuIS required tedious data wrangling in Excel and institutional knowledge of what analytes should be compared to which screening levels. With R, the process involves little more than a click of a button
Data Problem Solving that Makes Remediation Easier
R simplifying the complexity of the brownfield cleanup level process
Brownfield remediation cleanups require imagining a range of scenarios for the future use of a ‘clean’ property. Will the site be used for residential, commercial, or industrial purposes? What pollutants are present and where? It all starts with the cleanup level criteria.
Overall, this work by Aspect’s data team – who are meticulous at knowing the state-of-the-science regulatory criteria – ensures Aspect’s project teams have the correct screening or cleanup levels based on the most current toxicity guidance, which helps avoid rework later on in the process and saves time and money for the client.


