Data Teams as Gatekeepers to Unlock Brownfield Cleanups

Environmental data teams methodically confirm cleanup levels and visualize the 'cleanup finish line' with the regulatory criteria and client end goals

What is the measure of ‘clean’ at brownfield sites? Before any digging of contaminated dirt or treatment of contaminated groundwater, there is much upfront work by regulators and project teams – chemists, data analysts, geologists, engineers, and more – to determine the appropriate cleanup levels to use for a given site. The cleanup levels are the north star that every brownfield cleanup team steers by.

To Succeed, Be Sure What ‘Clean’ Looks Like

Aspect’s environmental data team regularly keeps the finger on the pulse of regulatory databases and uses tools – such as the open-source programming language R – to streamline brownfield cleanup projects.

Using R to automate screening level updates allows project teams to:

  • Make changes quickly and confidently

  • Minimize the risk of errors and omissions

  • Provide much-improved process transparency

  • Streamline communications across the project team

Keeping up on the best available science gives project managers greater assurance that their sites are being appropriately measured against regulatory criteria, providing a smoother path forward in the management and remediation of contaminated sites.

A Peek into Regulatory Data World with CLARC

CLARC is the Washington State Department of Ecology’s (Ecology) Cleanup Levels and Risk Calculation spreadsheet that is the basis for calculating cleanup levels under Ecology’s Model Toxics Control Act (MTCA). MTCA is Washington state’s cleanup rule which governs over 13,000+ known or suspected contaminated sites. CLARC is a key measure of what defines success at these cleanup projects and a living document that is maintained and updated by Ecology, as needed, with major updates every six months to align with changes to state and federal regulatory (e.g., US Environmental Protection Agency (EPA)) criteria.

Aspect engineer evaluating a vapor intrusion system at Art Brass Plating – a South Seattle cleanup site. The measure of success for these systems — and projects — rely on knowing the correct and up-to-date cleanup level criteria

The data tables in CLARC provide the various input parameters used to calculate screening levels for a huge array of chemicals in soil, groundwater, surface water, soil gas, and air—as well as the resulting calculated cleanup level values themselves. The calculated values are routinely used by remediation project managers to screen analytical results (from samples collected in the field) against federal, state, or other regulatory thresholds.

What is R and How Does it Accurately Automate Away Manual Data Entry?

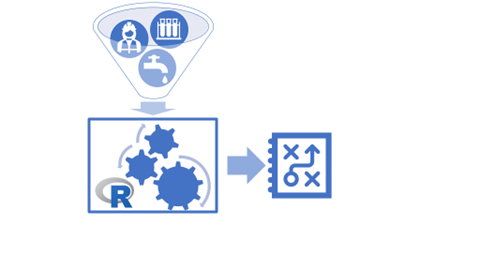
R is an open-source software environment used for statistical computing and graphics. Recently, Aspect’s data team wrote a package of R code to use CLARC’s input parameters to calculate a suite of specific screening levels. The same code can be run any time the input values in CLARC are updated, generating quality assurance tables to alert Aspect’s data team of potential issues, and providing summary tables for Aspect project managers to review cleanup level changes and consider their potential impact to their various environmental sites.

Various input parameters, including regulatory requirements, chemistry, site use, human safety and environmental quality are entered into our custom R tool to make and maintain a reliable, reproducible metric set for project success

Since there are usually screening levels for hundreds of different analytes at remediation cleanups  – e.g., petroleum and diesel, arsenic, tetrachloroethylene and more – when the CLARC database is updated by the regulator, it can be difficult to see if there have been any changes and which analytes may have been affected.

Aspect uses the industry standard EQuiS environmental data management system. The R tool helps us better use EQuIS to manage and screen environmental data against cleanup levels. Before using R, preparing CLARC-based screening and cleanup levels for upload to EQuIS required tedious data wrangling in Excel and institutional knowledge of what analytes should be compared to which screening levels. With R, the process involves little more than a click of a button

Data Problem Solving that Makes Remediation Easier

R simplifying the complexity of the brownfield cleanup level process

Brownfield remediation cleanups require imagining a range of scenarios for the future use of a ‘clean’ property. Will the site be used for residential, commercial, or industrial purposes? What pollutants are present and where? It all starts with the cleanup level criteria.

Overall, this work by Aspect’s data team – who are meticulous at knowing the state-of-the-science regulatory criteria – ensures Aspect’s project teams have the correct screening or cleanup levels based on the most current toxicity guidance, which helps avoid rework later on in the process and saves time and money for the client.

Guiding Operators to Safe Design for 1,100+ Dams

The public perception of water supply dams may bring to mind huge reservoirs, such as the Hoover Dam in Nevada and, in the Pacific Northwest, the Grand Coulee dam. However, Washington state also is charged with regulating and monitoring over a thousand dams of varying sizes, most of them under 50 feet tall. These largely earthen dams are used for a variety of irrigation, water quality, and recreation purposes.

Grand Coulee Dam
Source: Bureau of Reclamation

Helping Dam Owners Plan for Storm and Precipitation Impacts on Dams

Washington’s Dam Safety Office conducts design, planning, and construction inspection and monitoring to ensure dams and owners (the majority of the dams they monitor are privately owned) operate in a safe manner. As part of the regulations, dams are required to meet specific risk-based design requirements during major storms, particularly anticipating heavy rain and or snow events.

Every 10 years, precipitation data is gathered across hundreds of weather stations throughout the state for storm event analysis to help determine safety design criteria. These data and analysis are used by dam owners and state dam safety engineers to ensure design requirements are met.

A Better Software Tool for Dam Safety Projects

“We are very happy with the updated calculator developed by the Aspect-MGS team. It will benefit many dam engineers for the next decade.”

- Dam Safety Office manager Joe Witczak.

Aspect’s software development team, in collaboration with Washington’s Dam Safety Office and MGS Engineering Consultants, co-designed and developed a more user intuitive application for both dam owners and dam safety engineers for risk-based design. The Precipitation Magnitude-Frequency Calculator application helps dam owners determine their requirements by dam location and storm duration event. Users can now more easily select their dam location, storm event durations (small, medium, large), and quickly see the safety design requirements for their particular location. The new calculator is available to download as a zip file on the state’s website.

Contact Chris Bellusci and Mike Mills for more information on Aspect’s software development services for science and engineering projects.

Talking Field Data Collection at 2019 OCEAN Connect Conference on April 11

Over the past decade or two, technological advancements have presented opportunities to streamline field data collection. However, migrating field staff to a paperless workflow requires more than choosing the right software and hardware.

On April 11, Aspect’s John Warinner and Robyn Pepin will cover this topic and give tips on how to effectively convert field data collection from paper to digital process at the 2018 Oregon Conservation Education and Assistance Network (OCEAN) Connect Conference in Sunriver, Oregon.

Key areas of the presentation will include:

  • Overview of commercial off-the-shelf software and reporting systems

  • Case studies and lessons learned by Aspect’s field and data teams

  • Successful talking points to convince decision makers

See good field techniques and analysis put into practice, with some mountain biking thrown in for good measure here:

It's IPAD Mini vs. Trimble GPS in a mapmaking showdown on the sunny trails of the Chelan-Douglas Land Trust in the Wenatchee Valley.

And read more about our experience with how one suite of field data technology has improved our workflow.


Meet Chris Bellusci and Blair Deaver

Chris Bellusci and Blair Deaver recently joined Aspect's Bend, Oregon office.  Here are five questions we asked to get to know them better.

Chris Bellusci, Associate Business Systems Architect

Chris hiking near the Maroon Bells -- two peaks in the Elk Mountains in Colorado.

1.    Where are you from? If you’re not from the Pacific Northwest, what brought you here? 

I was born and raised in Missoula, Montana on a small ranch, where I developed my love for the outdoors and our natural resources. From Missoula, I moved to Seattle where I spent 10 years going to school, working, and exploring all the great outdoor activity it had to offer. But I felt I needed to get back to something a bit smaller in city size (and more sunshine) so I moved to Bend, Oregon, a place I really call home and have loved it ever since. 

2.    What inspired you to pursue data infrastructure? What made you curious about it?

My degree is in Electrical Engineering, but my first job right out of school was for Boeing Aerospace where I supported the hardware and software that developed the first design-by-wire aircraft, the 777. I saw the power of how technology can revolutionize an industry or a way of doing business. This set my path into the world of software. 

3.    What do you like best about your area of expertise? What excites you and keeps you motivated?

My focus is helping industries solve their complex business problems by applying technology solutions. My real belief is business process should drive the technology approach, which is why I enjoy learning so much about our client’s business and helping them to find the best solution to meet their business needs. I believe that applying technology to better manage our natural resources is the next great frontier.

4.    What do you like to do when you aren’t working? 

Being outside!!! I love Bend because of the four seasons it has to offer and I love being outside in each one of them, whether if it’s 90 degrees in July or 10 degrees in January. Hiking, biking, camping, skiing--I enjoy all of it!  

5.    Where in the world would you like to travel next? 

It has been over 15 years since I have visited Europe and I would like to get back there again this time with our two children. I would like them to see and experience other cultures, plus I have an older brother that lives in London, UK, so a good excuse to go.

Blair Deaver, Senior Geospatial Data Scientist

Blair riding the Jem biking trail in Utah.

1.    Where are you from? If you’re not from the Pacific Northwest, what brought you here? 

I grew up in Washington, D.C. I fled west for college in search of real mountain ranges I could explore on my mountain bike.

2.    What inspired you to pursue GIS and IT? What made you curious about it?

When I was going to school at the University of Oregon I worked part-time for the US Forest Service as a Hydro-technician in Oakridge, OR. I was a seasonal employee with aspirations for a full-time field job.  I quickly determined that a full-time job would be difficult. A peer at the time mentioned to me that if he were me, he would learn everything there is to know about this thing called “GIS”.  I quickly transitioned much of my school focus to Geography and GIS.  I was fascinated by GIS and quickly learned all I could.  When I graduated college, I was fortunate to get a job at Esri in Redlands, CA. I went from working in the woods for 10 hours a day to helping Esri customers solve technical problems behind a desk. The transition was a bit rough at first, but I have loved every minute of it. 

3.    What do you like best about your area of expertise? What excites you and keeps you motivated? 

I love the pairing of earth science + technology to solve real problems. I enjoy working with others to focus on the mastery of understanding a problem rather than quickly jumping to an engineering solution. I have worked over 20 years in the geospatial and IT industry. I have seen lots of change in the industry. What motivates me daily is to always keep learning. Being able to design and deliver technology solutions for earth science customers requires technical agility, creativity, and a solid understanding of the problem you are trying to solve.

4.    What do you like to do when you aren’t working? 

I love being a father and husband. You may also find me riding and racing my bicycle on trails throughout the PNW. I also love trail running and winter sport activities.

5.    Where in the world would you like to travel next? 

I would love to travel to Africa. All parts of Africa. I better save up my vacation.
 

Lea Beard Talks Tableau and EQuIS at ICEDM in Oregon

Aspect’s Lea Beard was invited to speak at the 7th Annual International Conference for Environmental Data Management (ICEDM) this week in Oregon.  Lea’s talk is on using environmental data management systems such as EQuIS in conjunction with powerful graphical analytics systems like Tableau to easily produce reliable, beautiful insights into data.