

More water earlier and less snow – the Columbia River Basin’s water health was recently forecast into 2040 as the result of a two-year study across the Washington State Department of Ecology, Washington State University, University of Utah, State of Washington Water Research Center, and Aspect Consulting in the 2021 Long-Term Water Supply & Demand Forecast.

Photo Credit: Robyn Pepin, Aspect Consulting. Columbia River near Entiat
This mammoth water evaluation project – done every five years since 2006 – looks across the Columbia River Basin, which includes 34 eastern Washington watersheds. Hydrological modeling, economic modeling, regulatory context, remote sensing, surface water and groundwater monitoring and more all are studied to predict the future of water for agriculture, population growth, and instream flow health under a changing climate in this critical basin.
Forecast Insights for the 4th Largest Watershed in North America
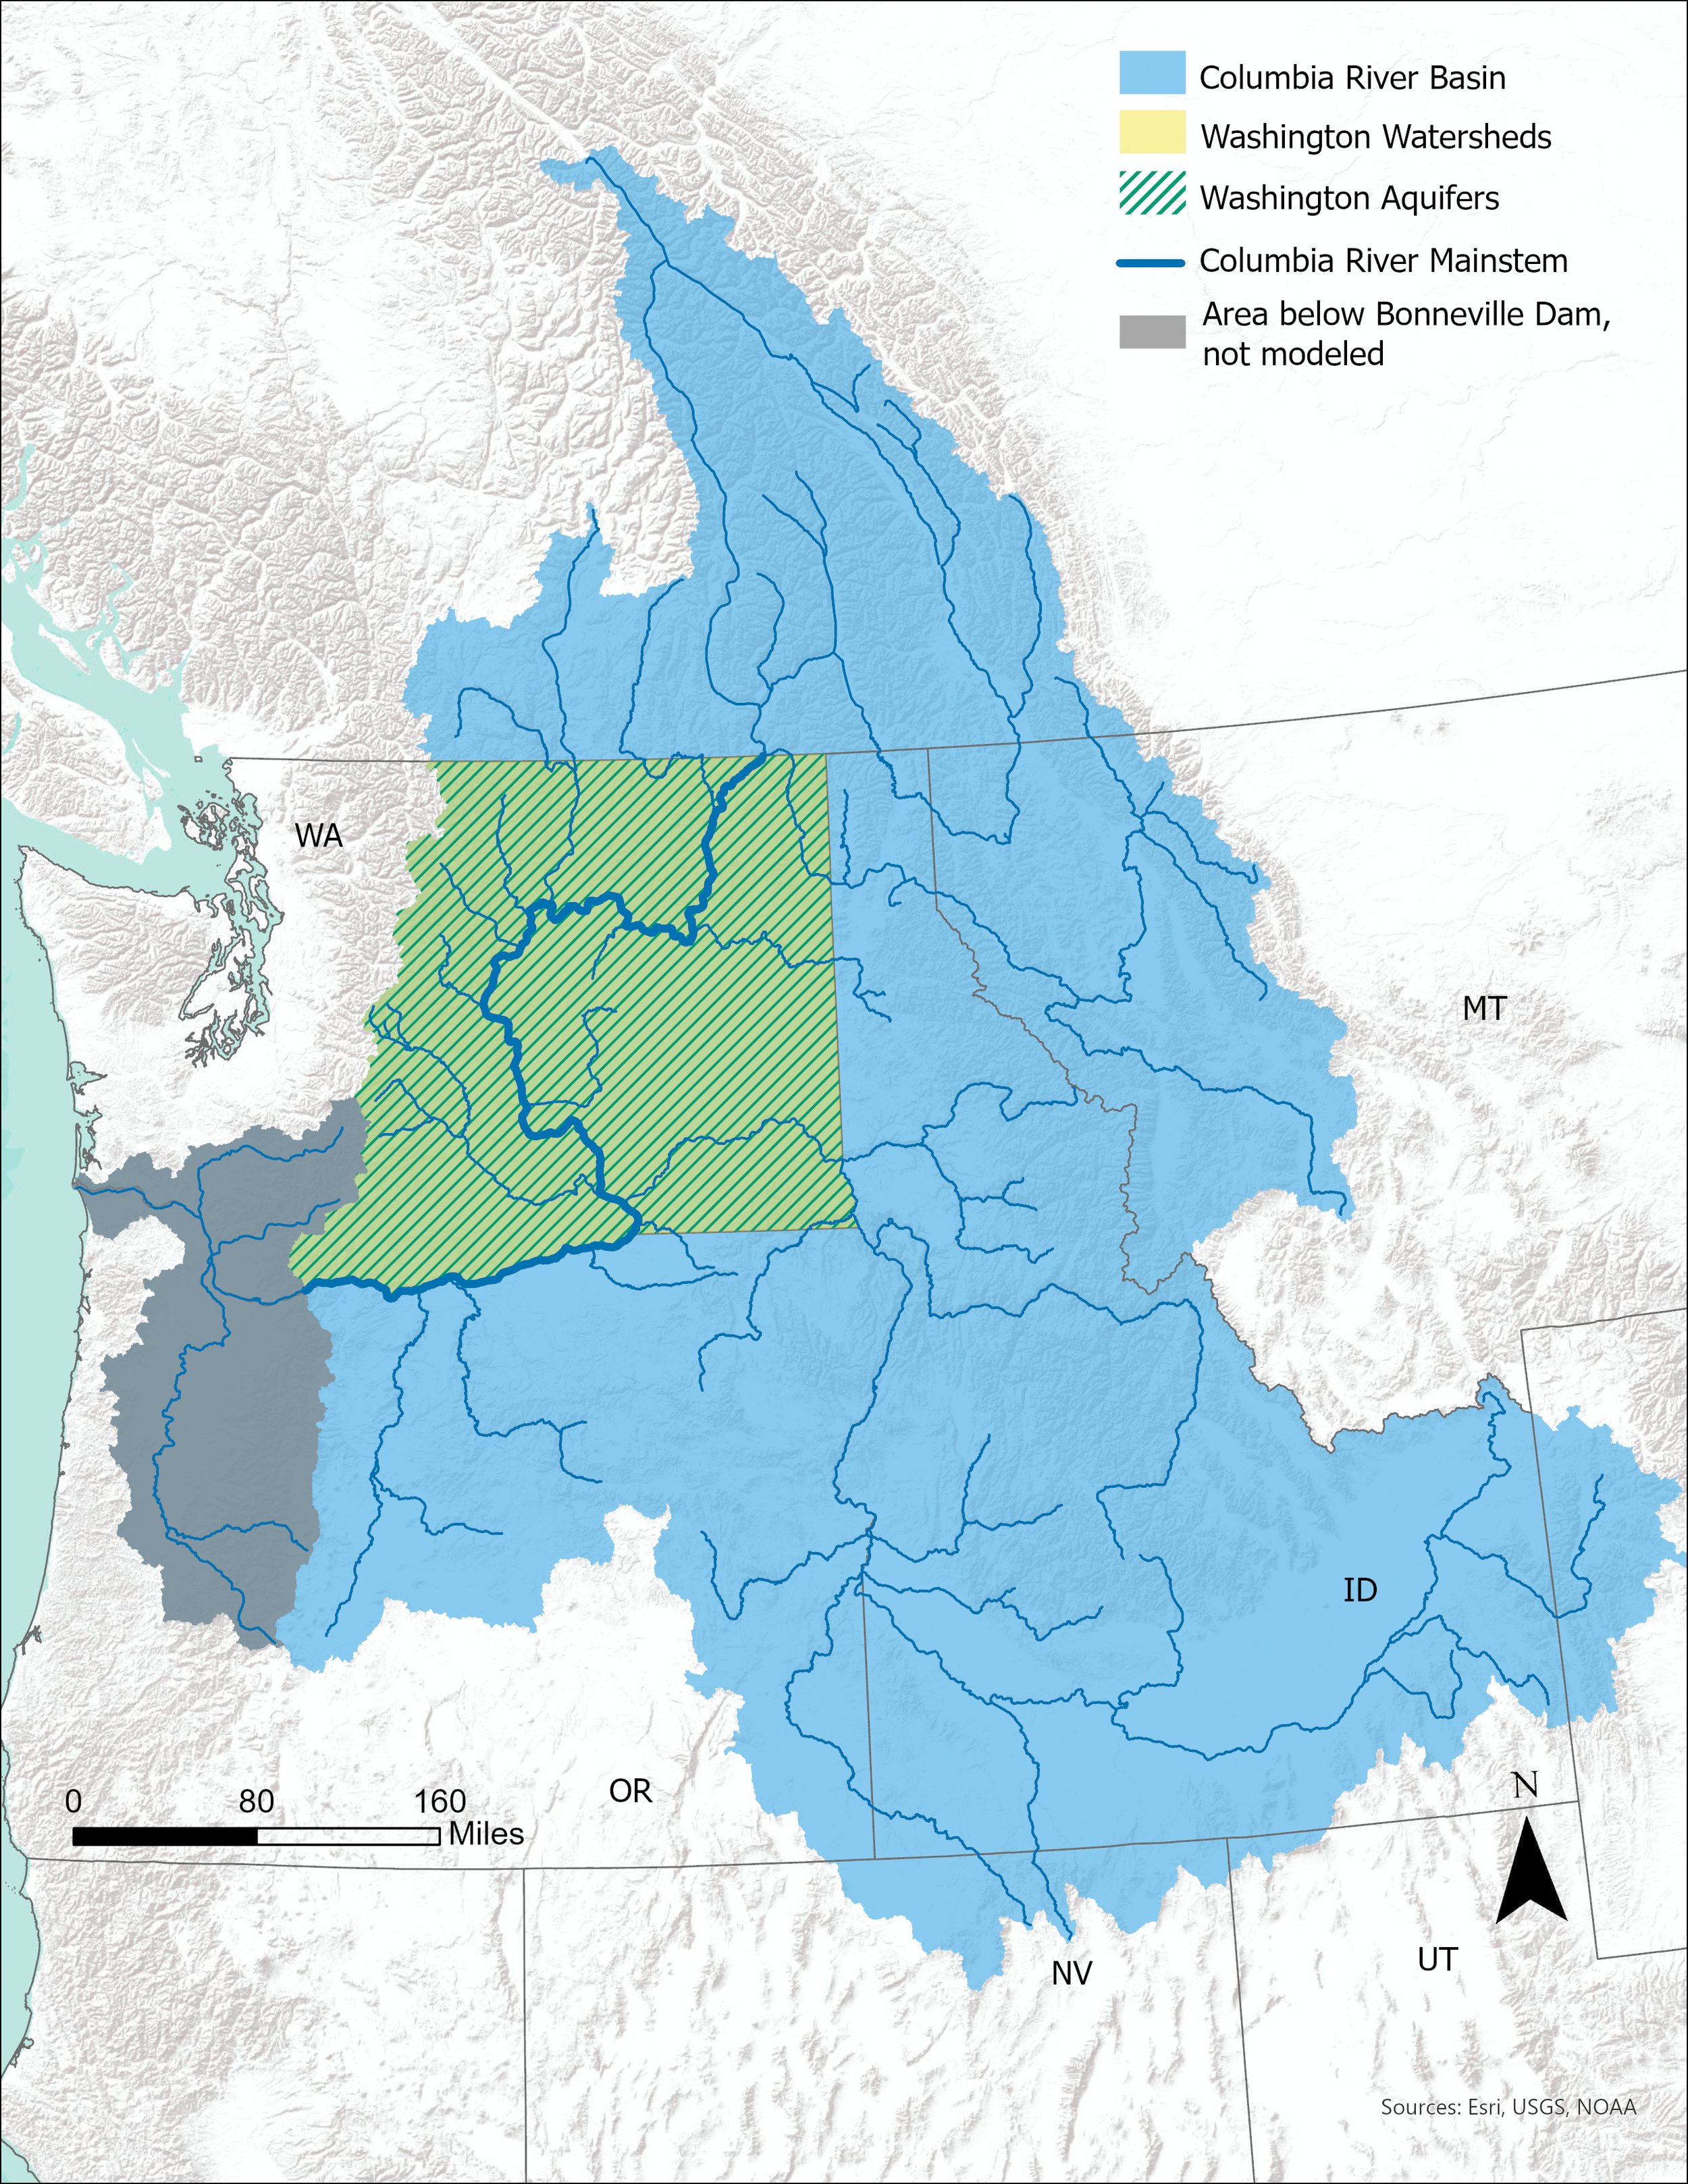
Image Source: 2021 Columbia River Basin Long-term Water Supply and Demand Forecast
The Columbia River Basin is the 4th largest watershed in North America, running down from headwaters in Canada and mainly into four states – Washington, Oregon, Idaho, and Montana. Some notable details and insights from the recent forecast include:
Wet months getting 15% more water and dry months getting 28% less water
Earlier planting dates and more heat stress during the hot months
17% higher population growth across Washington state leading to increases in demand for residential water and hydroelectric power
Trends in groundwater levels across the last 20 years were predominantly declining across the basin. The steepest declining trends correspond with the most heavily pumped layers and areas such as the Grand Ronde aquifer in the Odessa Sub Area and the Wanapum aquifer in parts of the Yakima Basin and Horse Heaven Hills.

Expected changes that will influence future water supplies and demands. These expected trends inform the scenarios explored in the 2021 Forecast.
Graphic Source: 2021 Columbia River Basin Long-term Water Supply and Demand Forecast
A 2040 Water Crystal Ball: Water Retiming Means More Water Earlier
Among the many takeaways in this report is the impact of climate change on water cycles. Chief among those is the prediction that peak surface flows – that feed the historically typical April – October agricultural season – will begin earlier, thus leaving less water available later in the summer when demand for that water is higher. Snowpack – the Pacific Northwest’s natural water reservoirs – will likely melt earlier because of warmer temperatures.
This ripple effect will influence agriculture starting earlier in the growing lifecycle; instream flow challenges with higher temps for fish habitat; and populations in arid regions will likely be incrementally more dependent on groundwater to serve future water supply. Declining groundwater trends mean that alternative water supplies may not be available in some areas so additional solutions are needed.

Time (in years) until the average available saturated thickness has declined by 25% in at least one aquifer layer in each groundwater subarea.
Image Source: 2021 Columbia River Basin Long-term Water Supply and Demand Forecast
State-of-the-Science Research
Aspect teamed with the project team and the scope of the science and monitoring over the last two years is impressive. A team of scientists and engineers looked at remote sensing and telemetry data across eastern Washington; climate change forecasts; population growth projections; well logs; and water rights. Some of the months-long study details of that include:
Integrated hydrological, river operations, crop production, and municipal, domestic and industrial water demand modeling in 34 watersheds under 34 potential climate change scenarios
Groundwater level trend analysis on 670+ wells
Automated well log review of over 4,000+ well logs
Manual well log review of 300+ well logs
Learn more also at WA Ecology’s project StoryMap here.